- Study Anytime, Anywhere through Our Mobile App & Web Portal
- 1000+ Video Lectures by CAT/XAT Topper Faculties
- 400+ Hours content of CAT Preparation Videos
- 9000+ Questions in Online CAT Coaching Course
- 200+ Topic Based Tests (50+ Basic, 50+ Moderate & 50+ Advanced Level)
- 20+ CAT Mocks (Pro CATs – Best Online Tests Series for CAT)
- 10+ Mock OMETs (Online Test Series for SNAP, NMAT, IIFT, XAT, TISS, CMAT)
- Online Doubt Solving on One – to – One basis
- GD-PI-WAT Online Preparation Material
Get access to the detailed solutions to the previous years questions asked in IIM IPMAT exam
We are given the following table,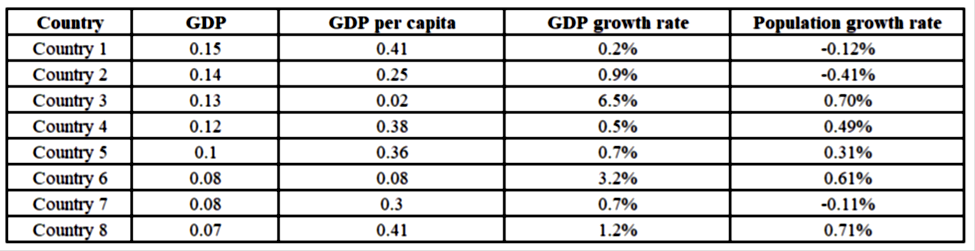
This table compares the GDP, GDP per capita, and population of eight countries, all of which are referenced using a consistent set of units.
Specifically, the GDP values are all given with the same country as the reference point (The reference point being Country 9)
Similarly, the GDP per capita among the eight countries in the table is given using the same reference point (The reference point being Country 10)
As a result, when comparing two countries from the list in terms of GDP, GDP per capita, or population, we can directly use the values presented in the table, since they are all based on a uniform reference point.
We can compare the population of two countries using the formula 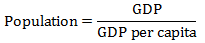
For example, to compare the GDP of Country A and Country B, we can simply use the values listed under "GDP" in the table, as both are referenced using the same country throughout. This eliminates the need for additional conversions or adjustments.
We are given the GDP growth rate and we are told it is constant over the next three years,
Country 4 GDP: 0.12 and the given growth rate is 0.5%
GDP of Country 4 in 2026 will be 0.12 × (1.005)2 this equals 0.121203
Country 4 GDP: 0.1 and the given growth rate is 3.2
GDP of Country 5 in 2026 will be 0.1 × (1.007)2 this equals 0.1014049
Ratio will be, 0.121203/0.1065024 this equals 1.19523