- Study Anytime, Anywhere through Our Mobile App & Web Portal
- 1000+ Video Lectures by CAT/XAT Topper Faculties
- 400+ Hours content of CAT Preparation Videos
- 9000+ Questions in Online CAT Coaching Course
- 200+ Topic Based Tests (50+ Basic, 50+ Moderate & 50+ Advanced Level)
- 20+ CAT Mocks (Pro CATs – Best Online Tests Series for CAT)
- 10+ Mock OMETs (Online Test Series for SNAP, NMAT, IIFT, XAT, TISS, CMAT)
- Online Doubt Solving on One – to – One basis
- GD-PI-WAT Online Preparation Material
Get access to the detailed solutions to the previous years questions asked in IIM IPMAT exam
Writing down the values given in the candlestick chart in the form of a table for ease of calculation,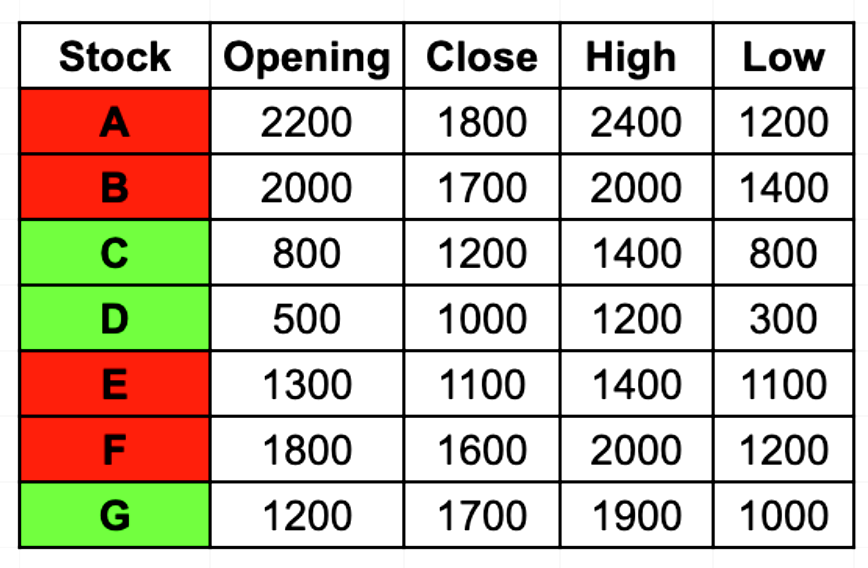
Daily loss for a share is defined as (Opening price - Closing price) / (Opening price)
Calculating this for the options:
Stock A: 400/2200 = 2/11
Stock B: 300/2000 = 3/20
Stock F: 200/1800 = 1/9
Stock G gained money that day
Hence Stock A has the highest Daily Loss.